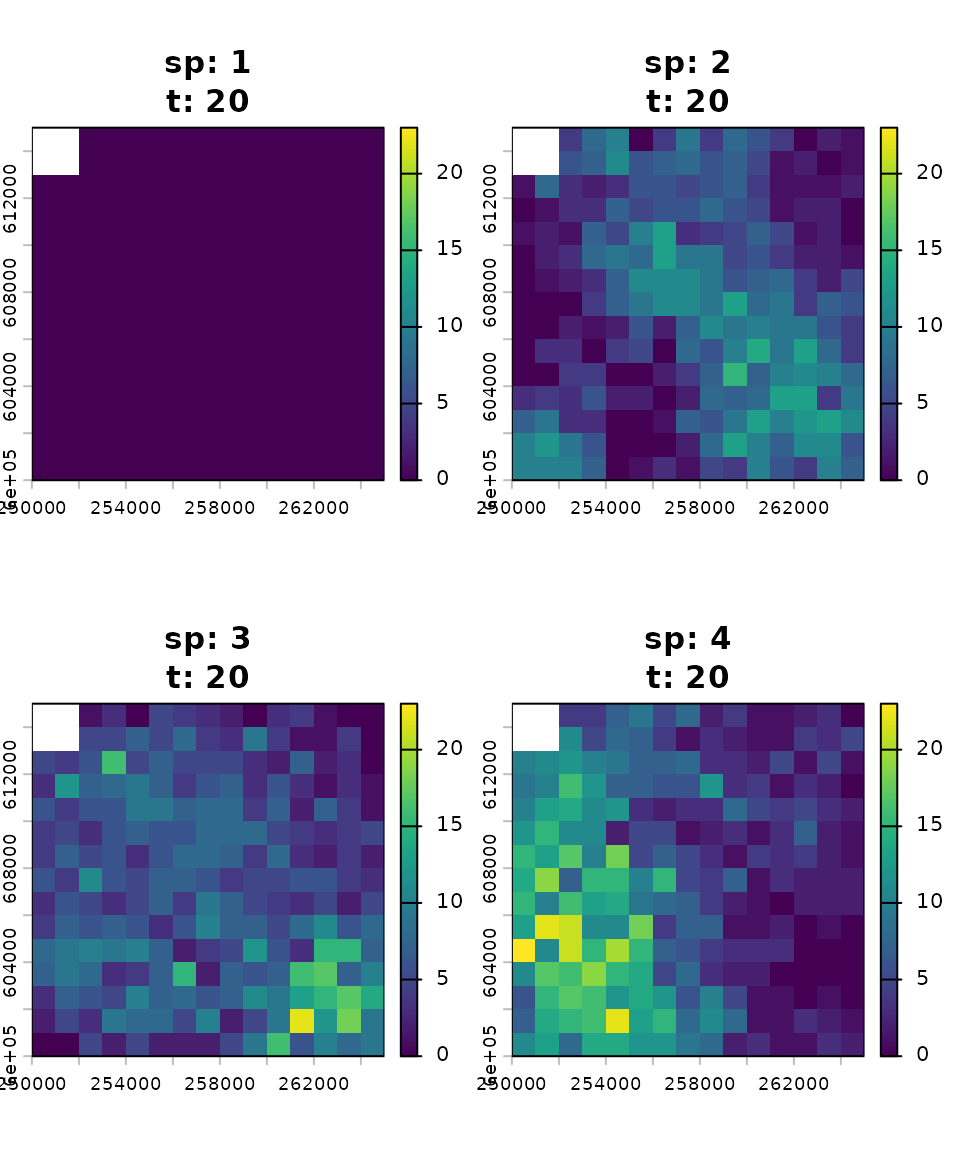
Draws simulated abundance maps for any species at any time
Arguments
- x
An object of class
sim_com_results, returned bysim_com().- species
Integer vector. Species ID(s) to plot.
- time_points
Integer vector. Time step(s) to plot (excluding burn-in).
- type
Character vector of length 1. Type of map: "continuous" (default), "classes" or "interval" (case-sensitive)
- main
Character vector. Plot titles (one for each layer)
- range
Numeric vector of length 2. Range of values to be used for the legend (if
type = "continuous"), which by default is calculated from the N_map slot ofsim_com_resultsobject- ...
Further arguments passed to
terra::plot
Value
#' * If length(time_points) == 1, returns a SpatRaster with species as layers.
If only one species is selected with multiple time points, returns a single
SpatRaster.
Examples
# Read simulation data from the mrangr package
simulated_com <- get_simulated_com()

# Plot
plot(simulated_com)